by Aaron Shi, Zachary DeVito
During your time with PyTorch on GPUs, you may be familiar with this common error message:
torch.cuda.OutOfMemoryError: CUDA out of memory. Tried to allocate 512.00 MiB. GPU 0 has a total capacity of 79.32 GiB of which 401.56 MiB is free.
In this series, we show how to use memory tooling, including the Memory Snapshot, the Memory Profiler, and the Reference Cycle Detector to debug out of memory errors and improve memory usage.
Memory Timeline
The Memory Snapshot tool provides a fine-grained GPU memory visualization for debugging GPU OOMs. Captured memory snapshots will show memory events including allocations, frees and OOMs, along with their stack traces.
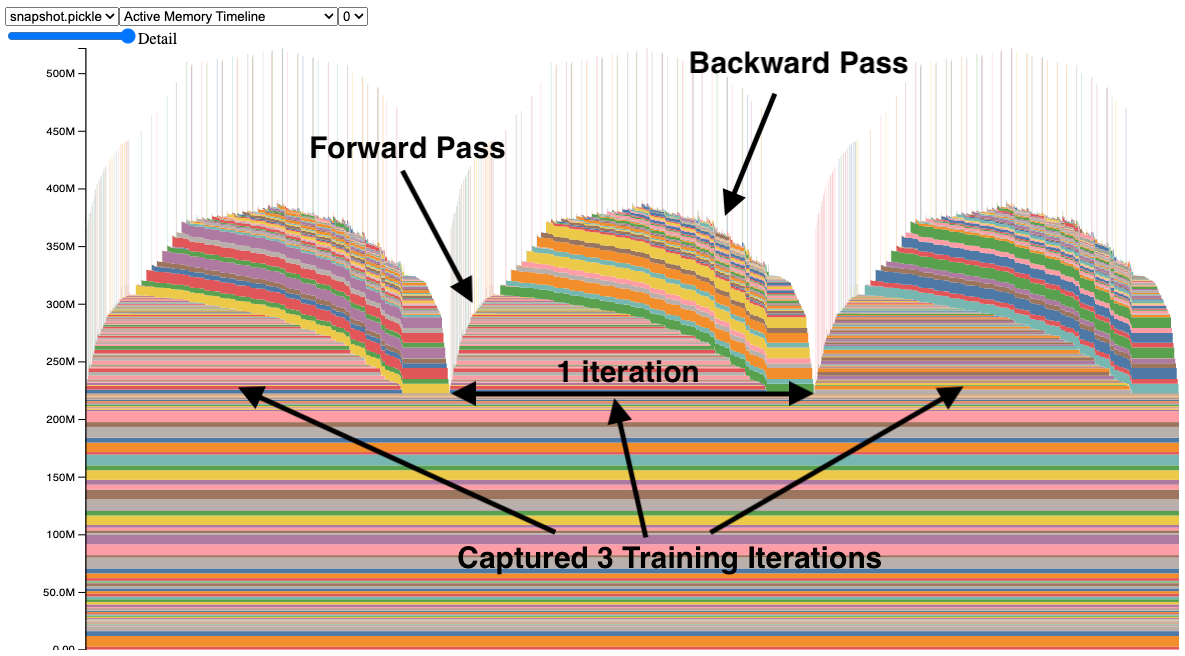
In a snapshot, each tensor’s memory allocation is color coded separately. The x axis is over time, and the y axis is the amount of GPU memory in MB. The snapshot is interactive, so we can observe the stack trace for any allocation by mousing over. Try it yourself at https://github.com/pytorch/pytorch.github.io/blob/site/assets/images/understanding-gpu-memory-1/snapshot.html.
In this snapshot, there are 3 peaks showing the memory allocations over 3 training iterations (this is configerable). When looking at the peaks, it is easy to see the rise of memory in the forward pass and the fall during the backward pass as the gradients are computed. It is also possible to see that the program has the same pattern of memory use iteration to iteration. One thing that stands out is the many tiny spikes in memory, by mousing over them, we see that they are buffers used temporarily by convolution operators.
The API to capture memory snapshots is fairly simple and available in torch.cuda.memory:
torch.cuda.memory._record_memory_history(max_entries=100000)torch.cuda.memory._dump_snapshot(file_name)torch.cuda.memory._record_memory_history(enabled=None)Code Snippet (for full code sample, see Appendix A):
   # Start recording memory snapshot history, initialized with a buffer
   # capacity of 100,000 memory events, via the `max_entries` field.
   torch.cuda.memory._record_memory_history(
       max_entries=MAX_NUM_OF_MEM_EVENTS_PER_SNAPSHOT
   )

   # Run your PyTorch Model.
   # At any point in time, save a snapshot to file for later.
   for _ in range(5):
       pred = model(inputs)
       loss_fn(pred, labels).backward()
       optimizer.step()
       optimizer.zero_grad(set_to_none=True)

   # In this sample, we save the snapshot after running 5 iterations.
   #   - Save as many snapshots as you'd like.
   #   - Snapshots will save last `max_entries` number of memory events
   #     (100,000 in this example).
   try:
       torch.cuda.memory._dump_snapshot(f"{file_prefix}.pickle")
   except Exception as e:
       logger.error(f"Failed to capture memory snapshot {e}")

   # Stop recording memory snapshot history.
   torch.cuda.memory._record_memory_history(enabled=None)
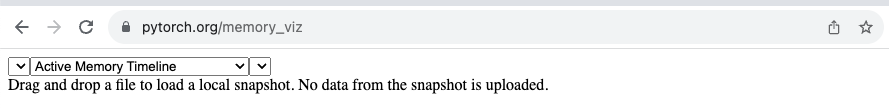
To visualize the snapshot file, we have a tool hosted at https://pytorch.org/memory_viz. There, you can drag and drop your saved snapshot file and it will plot each allocation over time. Privacy Note: The tool will not save your snapshot.
Memory Timeline
Alternatively, you can generate an HTML from a .pickle by using the script at pytorch/torch/cuda/_memory_viz.py, here is an example: